Charts
Discover what kind of charts you can use within Ludus, to present your data in the best way possible.
Types of charts
Ludus supports 10 different types of graphs, adapted to the majority of situations.
- Area
- Bar
- Bubble
- Donut
- Gauge
- Line
- Pie
- Radar
- Scatter
- Step Area, bar, bubble, line, radar, scatter and step charts can be used with multiple values per series. Donut, gauge, and pie only use a value par series.
Data format
Markdown
In Markdown, each line is a series of data, preceded by the minus character. Each series has a name and a set of values, separated by the colon character. Each value is separated by a comma.
Example:
- a: 10, 30, 20
- b: 12, 15, 40
- c: 39, 13, 55
- d: 2, 99, 41
- e: 11, 48, 31
- f: 41, 45, 33
CSV
You can also use the CSV format for your data, making it easy to copy and paste your data from Excel or Google Spreadsheets. The first line should contain the labels and the other lines should contain the data. Accepted separators are tabulations, commas, semicolons, and vertical bars.
Example:
a, b, c
1, 3, 12
33, 3, 55
9, 22, 19
Options
Custom colors
You can add custom colors next to your column titles:
- Orange{{#110011}}: 20, 30, 40
- Apple{{#232323}}: 20, 50, 10
Or in CSV:
Orange{{#110011}}, Apple{{#232323}}
20, 20
30, 50
40, 10
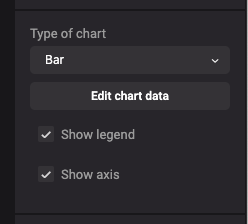
Show legend and show axis
You can decide to show and hide the legend and this axis, via checkboxes located in the properties column.
Here is how it looks like with legend and axis:
.png)
Without the legend:
.png)
And without the legend and axis:
.png)